In my previous article, I described how to backtest quantitative trading on the TradingView platform and today, I will share some strategies. I will separate them into sections and update one strategy each time. I will continue to update them, so you can look forward to it. Thank you for your support and encouragement. I hope you will subscribe to my YouTube channel @shousake
在之前的文章中,我讲述了如何在TradingView平台进行量化交易的回测,今天我们来分享一些策略.我会分开来,每期更新一种策略,会持续更新,大家可以期待一下,感谢大家的支持和鼓励,希望大家多多订阅一下我的YouTube频道@shousake
The Moving Average/MA均线
The Moving Average (MA) is one of the most widely used technical indicators in financial markets. It smooths out price data by calculating the average price over a specific period, helping traders identify trends and reduce the impact of short-term price fluctuations. Common types include the Simple Moving Average (SMA) and the Exponential Moving Average (EMA). While the SMA gives equal weight to all data points, the EMA assigns more weight to recent prices, making it more responsive to market changes. Traders often use MA crossovers or the slope of the line to determine buy and sell signals.
移动平均线(MA)是金融市场中最常用的技术指标之一。它通过计算一段时间内的平均价格来平滑价格数据,帮助交易者识别趋势,并减少短期价格波动的影响。常见的类型有简单移动平均线(SMA)和指数移动平均线(EMA)。SMA对所有数据点赋予相同的权重,而EMA对最近的价格赋予更高的权重,使其对市场变化更敏感。交易者通常会利用均线的交叉或斜率来判断买入和卖出的时机。
The following code is a trading code based on the moving average (MA) and is written in Pine language.
以下代码是基于移动平均线(MA)的交易代码,用Pine语言编写。
//@version=5
strategy("MA80 Daily Strategy", overlay=true, margin_long=100, margin_short=100, default_qty_type=strategy.percent_of_equity, default_qty_value=5,pyramiding=0)

// === 参数 ===
maLength = 80
src = close
ma = ta.sma(src, maLength)
startDate = input.time(timestamp("01 Jan 2023 00:00 +0000"), "Start Date", group="Time Filter")
endDate = input.time(timestamp("31 Dec 2024 23:59 +0000"), "End Date", group="Time Filter")
inDateRange = time >= startDate and time <= endDate
// 绘制 MA
plot(ma, color=color.orange, title="MA80")

// 判断每日最后一根K线
isNewDay = ta.change(time("D")) != 0  // 新的一天
isLastBarOfDay = not isNewDay[1] and isNewDay // 当天最后一根

// 策略逻辑
longCond = close < ma
shortCond = close > ma

// 每日最后一根K线时才操作
if isLastBarOfDay and inDateRange
    // 平掉所有仓位
    //strategy.close_all(comment="Daily Close")

    // 建仓
    if longCond
        strategy.entry("Long", strategy.long)
    if shortCond
        strategy.entry("Short", strategy.short)
Understanding the RSI Algorithm and Hummingbot Directional RSI Configuration/理解 RSI 算法与 Hummingbot 方向性 RSI 配置
1. What is the RSI Algorithm?/什么是 RSI 算法?
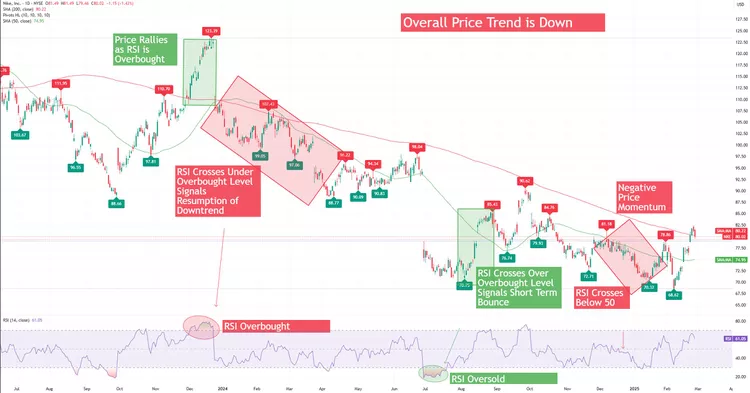
The Relative Strength Index (RSI) is a momentum oscillator developed by J. Welles Wilder in 1978, designed to measure the speed and magnitude of recent price changes to identify overbought or oversold conditions in a market.
相对强弱指数(RSI) 是由 J. Welles Wilder 于 1978 年提出的一种动量振荡指标,用来衡量价格变化的速度和幅度,从而判断市场是否处于超买或超卖状态
It produces values between 0 and 100, where readings above 70 typically indicate an overbought market and readings below 30 indicate an oversold market.
其数值范围在 0 到 100 之间,通常 RSI 高于 70 表示市场过热(超买),低于 30 表示市场过冷(超卖)。The formula is based on the ratio between average gains and average losses over a fixed number of periods, expressed as:
RSI 的计算基于一定周期内平均涨幅与平均跌幅的比值,其公式如下:
RSI = 100 – 100 / (1 + RS), where RS = Average Gain / Average Loss
RSI = 100 – 100 / (1 + RS),其中 RS = 平均涨幅 / 平均跌幅
For example, a 14-period RSI looks back 14 candles; if most candles closed higher than they opened, RSI will increase, showing bullish strength.
例如,14 周期的 RSI 会回溯 14 根 K 线;若大多数 K 线收盘价高于开盘价,RSI 就会上升,表明买盘动能增强。
Traders use RSI to find entry and exit points — they buy when RSI is low (oversold) and sell when RSI is high (overbought).
交易者利用 RSI 寻找入场与出场时机:当 RSI 过低(超卖)时买入,当 RSI 过高(超买)时卖出。
2.RSI in Hummingbot /Hummingbot 中的 RSI 策略
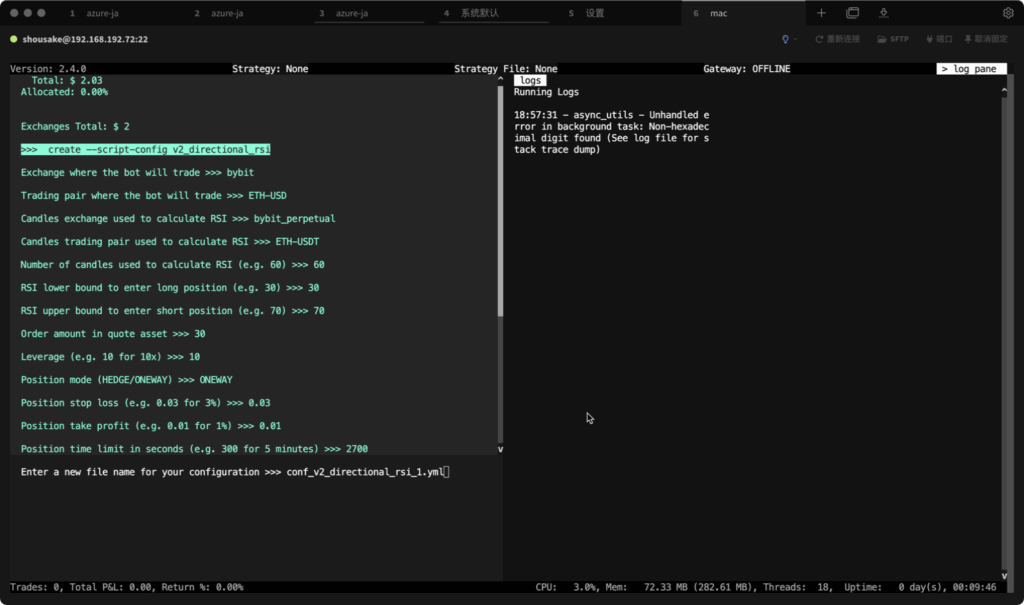
Hummingbot includes a built-in script called v2_directional_rsi.py, which automates trading decisions based on RSI signals instead of manual chart watching.
Hummingbot 内置了一个名为 v2_directional_rsi.py 的脚本,它能够根据 RSI 信号自动做出交易决策,而无需人工盯盘。
You can generate a configuration file by typing create –script-config v2_directional_rsi in the Hummingbot CLI, which prompts you to set all key parameters.
在 Hummingbot 命令行输入 create –script-config v2_directional_rsi 即可生成配置文件,系统会引导你填写所有关键参数。
create --script-config v2_directional_rsiThe main parameters include the exchange, trading pair, candle source, RSI bounds, order size, leverage, and risk limits (stop-loss, take-profit, time limit).
主要参数包括交易所、交易对、K 线数据源、RSI 上下阈值、下单金额、杠杆以及风险控制(止损、止盈与持仓时限)。
For example, RSI lower bound = 30 means the bot will go long when RSI drops below 30, while RSI upper bound = 70 tells it to short when RSI rises above 70.
例如,当 RSI 下限 = 30 时,机器人会在 RSI 低于 30 时开多;当 RSI 上限 = 70 时,会在 RSI 高于 70 时开空。
Each position is handled by the Position Executor, which automatically applies stop-loss, take-profit, and time-based exit rules — keeping your strategy disciplined and risk-controlled.
每个持仓都由 Position Executor 模块管理,会自动执行止损、止盈及时间平仓规则,从而保持策略的纪律性与风险控制。
This design allows traders to transform RSI signals into fully automated quant strategies that run 24 / 7 without emotional interference.
这种设计让交易者能够把 RSI 信号转化为可 24 小时运行的自动化量化策略,避免情绪化操作。
When configured correctly, the v2_directional_rsi script combines classic technical analysis with Hummingbot’s modern automation framework, creating a powerful tool for systematic crypto trading.
当配置得当时,v2_directional_rsi 脚本能将经典技术分析与 Hummingbot 的自动化框架结合,成为高效的系统化加密货币交易工具。
💰 Order and Risk Parameters/订单与风险参数
- Order amount in quote asset – how much to spend per trade (e.g., 30 USDT).
订单金额(计价币) —— 每次交易投入的 USDT 金额,例如 30。 - Leverage – the multiplier for futures trading (e.g., 10×).
杠杆倍数 —— 用于合约交易的倍数,例如 10 倍。 - Position mode (HEDGE/ONEWAY) – whether you allow simultaneous long and short positions. 持仓模式(HEDGE/ONEWAY) —— 决定是否允许多空双向持仓。
- Position stop loss – percentage loss at which to exit (e.g., 0.03 = 3%).
止损比例 —— 亏损 3% 时自动平仓。 - Position take profit – target profit percentage before closing (e.g., 0.01 = 1%).
止盈比例 —— 盈利 1% 时自动止盈。 - Position time limit in seconds – maximum holding duration (e.g., 2700 = 45 minutes).
持仓时间限制(秒) —— 持仓超过 2700 秒 即 45 分钟 会自动平仓。
3. RSI in TradingView
//@version=5
strategy("RSI 优化策略",
         overlay=true,
         // 以下参数请在策略的 "属性" 标签页中设置:
         initial_capital=10000,        // 初始资本
         default_qty_type=strategy.cash, // 订单大小类型 (设置为 "现金")
         default_qty_value=30,           // 订单大小 (例如 30 USDT)
         pyramiding=0,                 // 金字塔/加仓 (设置为 >1 可模拟对冲)
         commission_value=0)           // 手续费率 (设置为 0)

// —————— 1. 输入参数 (已填入优化值) ——————

// == 回测时间范围 (Backtest Period) ==
group_time = "回测时间范围 (Backtest Period)"
startTime = input.time(timestamp("01 Jan 2023 00:00 +0000"), "开始时间 (Start Time)", group=group_time)
endTime = input.time(timestamp("01 Jan 2024 00:00 +0000"), "结束时间 (End Time)", group=group_time)

// == 杠杆与风险 (Leverage & Risk) ==
group_risk = "杠杆与风险管理 (Leverage & Risk)"
leverage = input.int(10, title="杠杆倍数 (Leverage)", minval=1, group=group_risk)
sl_pct = input.float(0.015, title="止损比例 (Stop Loss %)", step=0.001, group=group_risk)
tp_pct = input.float(0.03, title="止盈比例 (Take Profit %)", step=0.001, group=group_risk)
// 持仓时间限制输入项已移除

// == 策略参数 (Strategy Parameters) ==
group_strategy = "策略参数 (Strategy Parameters)"
rsi_length = input.int(14, "RSI 长度 (RSI Length)", group=group_strategy)
rsi_overbought = input.int(75, "RSI 超买 (RSI Overbought)", group=group_strategy)
rsi_oversold = input.int(25, "RSI 超卖 (RSI Oversold)", group=group_strategy)


// —————— 2. 逻辑与计算 (Logic & Calculations) ——————

timeFilter = time >= startTime and time <= endTime
rsi = ta.rsi(close, rsi_length)
longCondition = ta.crossover(rsi, rsi_oversold)
shortCondition = ta.crossunder(rsi, rsi_overbought)

// —————— 3. 策略执行 (Strategy Execution) ——————

if (timeFilter)
    if (longCondition)
        strategy.entry("多单", strategy.long)
    if (shortCondition)
        strategy.entry("空单", strategy.short)

// == 出场逻辑 (Exit Logic) ==
for i = 0 to strategy.opentrades - 1
    // 止盈止损逻辑
    if strategy.opentrades.entry_id(i) == "多单"
        sl_price = strategy.opentrades.entry_price(i) * (1 - sl_pct)
        tp_price = strategy.opentrades.entry_price(i) * (1 + tp_pct)
        strategy.exit("多单出场", from_entry="多单", stop=sl_price, limit=tp_price)

    if strategy.opentrades.entry_id(i) == "空单"
        sl_price = strategy.opentrades.entry_price(i) * (1 + sl_pct)
        tp_price = strategy.opentrades.entry_price(i) * (1 - tp_pct)
        strategy.exit("空单出场", from_entry="空单", stop=sl_price, limit=tp_price)


// —————— 4. 图表绘图 (Plotting) ——————

plot(rsi, "RSI", color=color.new(color.orange, 0))
hline(rsi_overbought, "超买线", color=color.new(color.gray, 50))
hline(rsi_oversold, "超卖线", color=color.new(color.gray, 50))
fill(hline(rsi_overbought, "Overbought"), hline(rsi_oversold, "Oversold"), color=color.new(color.purple, 90))
bgcolor(timeFilter ? color.new(color.blue, 95) : na, title="回测时间范围")

// 在图表上标记 B (Buy) 和 S (Sell) 信号
plotshape(series=timeFilter and longCondition, title="Buy Signal", text="B", location=location.belowbar, style=shape.labelup, size=size.small, color=color.new(color.green, 25), textcolor=color.white)
plotshape(series=timeFilter and shortCondition, title="Sell Signal", text="S", location=location.abovebar, style=shape.labeldown, size=size.small, color=color.new(color.red, 25), textcolor=color.white)